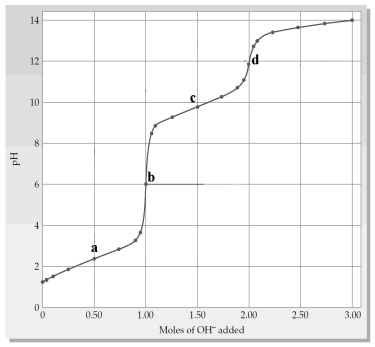
The following plot shows a titration curve for the titration of 1.00 L of 1.00 M diprotic acid H2A with NaOH. 
-Which point a-d represents the H2X/HX- buffer region?
Definitions:
Q32: Aniline, (C<sub>6</sub>H<sub>5</sub>NH<sub>2</sub>,K<sub>b</sub> = 4.3 × 10<sup>-10 </sup>at
Q33: Given that Br<sub>2</sub>(g)+ 2 e<sup>-</sup> → 2
Q55: The cell reaction for a dry cell
Q86: Based on the following information, Cl<sub>2</sub>(g)+ 2
Q96: A 0.050 M solution of hydroxylamine,NH<sub>2</sub>OH,having K<sub>b</sub>
Q103: What is the pH of a buffer
Q136: What is the equilibrium constant expression (K<sub>a</sub>)for
Q143: Shown below is a concentration vs.time plot
Q155: Which picture (2)-(4)represents the equilibrium mixture when
Q156: What is the molar solubility of AgCl