The following diagram is a cost-volume-profit graph for a manufacturing company: 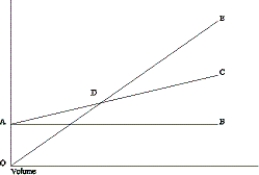
What is the formula to determine the Y-axis value ($) at point D on the graph?
Definitions:
Short-Run Instability
A situation in economics where variables such as output, employment, and prices are subject to frequent fluctuations over a short period.
Agriculture
The activity of farming the land, cultivating plants, and breeding animals for human needs and sustenance.
Causes
The reasons or motives behind certain events, actions, or outcomes, identifying why something happens.
Bumper Crop
An unusually large harvest of crops in a particular year.
Q9: The cost of goods sold for
Q25: Sales * Contribution Margin is a shortcut
Q33: Refer to the figure.What are the total
Q52: In a company that supplies garlic bread
Q75: Which of the following costs would NOT
Q85: Which of the following positions would most
Q101: The break-even point in units can be
Q113: What is a disadvantage of assigning costs
Q152: Refer to the figure.Under this new approach,which
Q163: In a cost management system,what does the