The following diagram is a cost-volume-profit graph for a manufacturing company:
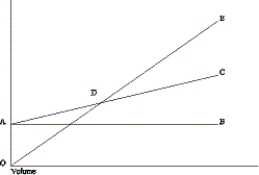
-Refer to the figure.Which of the following statements best describes the labelled item on the diagram?
Definitions:
Idle Time
Periods when resources are available but not in use, often due to delays, inefficiencies, or lack of demand, leading to wasted capacity.
Observations
The process of monitoring, recording, and analyzing data or events for the purpose of drawing conclusions or making decisions.
Predetermined Time Standard
A method used in industrial engineering and time management to estimate the time required for completing a task based on standard time units.
TMU
Time Measurement Unit, a standard unit used in time study and work measurement for setting standard times for tasks.
Q29: Which of the following is NOT significant
Q72: What is the term for the cost
Q81: What are the two methods used to
Q86: Refer to the figure.What is the cost
Q87: In the formula Y = F +
Q90: Standards for state and local governments are
Q92: Refer to the figure.How much was overhead
Q95: Camp Gordon has annual fixed operating costs
Q150: What is NOT the emphasis of total
Q239: What are the benefits of adhering to