Multiple Choice
Which one of the following graphs shows how the inductive reactance varies with frequency? 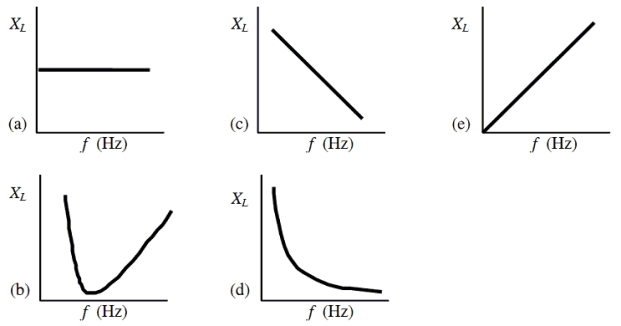
Definitions:
Related Questions
Q7: Which one of the following statements concerning
Q8: Complete the following sentence: In the condition
Q19: In the figure, point A is a
Q25: A 4.00-m long string, clamped at both
Q29: In a beta decay process, not all
Q38: The graph shows the variation in radiation
Q38: One string on a guitar is exactly
Q50: An aluminum nail has an excess charge
Q52: Assume that S has been closed for
Q56: Determine the value of the capacitance.<br>A)9.0 ×