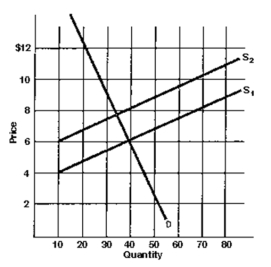
A.How much is the tax in the above graph?
B.How much of this tax is borne by the buyer and how much is borne by the seller?
C.As a result of the tax, by about how much does consumption fall?
Definitions:
Risk-Free Rate
The interest rate at which an investor can lend money with no risk of default, often represented by the yield on government bonds.
APT
The Arbitrage Pricing Theory is a model that predicts asset returns based on the relationship between an asset's return and several macroeconomic factors.
CAPM
The Capital Asset Pricing Model, a model that describes the relationship between systemic risk and expected return for assets, particularly stocks.
Risk-Return Relationship
The principle that potential return increases with an increase in risk, describing the trade-off between the desire for the lowest possible risk and the highest possible return.
Q38: When supply falls and demand stays the
Q54: The supply curve displays the wishes of
Q118: If your total revenue is $10 million,
Q129: If price were set by the government
Q173: The equilibrium quantity is about<br>A)14.5.<br>B)15.0.<br>C)15.5.<br>D)16.0.<br>E)16.5.
Q177: A change in demand refers to<br>A)a shift
Q187: The decision to go out of business<br>A)may
Q192: When demand falls and supply stays the
Q196: In the graph shown above, at a
Q199: When there is a surplus<br>A)quantity demanded is