A random sample of 30 executives from companies with assets over $1 million was selected and asked for their annual income and level of education. The ANOVA comparing the average income among three levels of education rejected the null hypothesis. The mean square error (MSE) was 243.7. The following table summarized the results: 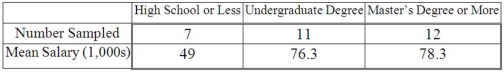 When comparing the mean annual incomes for executives with undergraduate and master's degrees or more, which of the following 95% confidence interval can be constructed?
Definitions:
Q13: The value of the correlation coefficient (r):<br>A)
Q17: To collect a sample, a population is
Q67: The human resources department of a software
Q75: The human resources department of a software
Q81: The net weights (in grams) of a
Q88: Recently, students in a marketing research class
Q108: A regression analysis yields the following information:
Q113: The interval within which a population parameter
Q113: The best example of a null hypothesis
Q125: A survey of property owners' opinions about