Multiple Choice
Use the graph given to solve the inequality indicated. Write the answer in interval notation. p(x) < 0 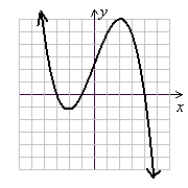 (Gridlines are spaced one unit apart.)
Definitions:
Related Questions
Q10: Where the contingent consideration is a financial
Q19: Use a calculator to find the value
Q25: For simple interest accounts the interest earned
Q29: A business combination could occur without any
Q34: The parties to a joint venture will
Q46: Compute the product. (3x - 1)(2x +
Q54: At the beginning of 2013, Ridley Ltd.
Q78: Use the direction/approach notation to describe the
Q105: Solve. Simplify your results. x<sup>2</sup> = -3x
Q106: State the exact value of sin