Essay
Graph the function using the Guidelines for Graphing Rational Functions, which is simply modified to include nonlinear asymptotes. Clearly state all intercepts and asymptotes and any additional points used to sketch the graph. 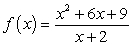
Definitions:
Related Questions
Q19: Compute the product. (x + 4)(x -
Q21: Find the vertex.<br>f(x) = x<sup>2</sup> + 10x
Q32: Solve using the elimination method. If the
Q60: Use De Moivre's Theorem to compute <img
Q64: Evaluate without the aid of calculators or
Q71: Determine if the ordered triple (0, -2,
Q85: Determine the value of the expression without
Q86: Compute the product z<sub>1</sub>z<sub>2</sub> using the trigonometric
Q97: Write this relationship in equation form.
Q192: Determine the location of any max or