Exhibit 15-6
Below you are given a partial computer output based on a sample of 16 observations. 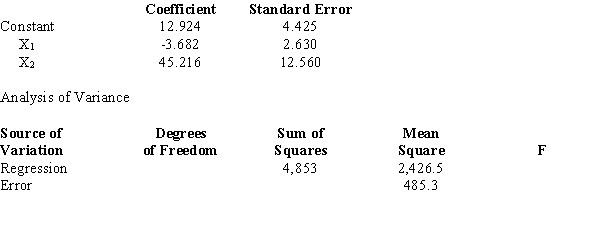
-Refer to Exhibit 15-6. The test statistic used to determine if there is a relationship among the variables equals
Definitions:
Normal Curve
A symmetrical bell-shaped curve that represents the distribution of many types of data where most values cluster around a mean.
Obtained Value
The score or number that results from a specific measurement or calculation.
Critical Value
A threshold in a hypothesis test that determines the boundary for rejecting the null hypothesis.
Type II Error
A statistical error that occurs when a false null hypothesis is not rejected, meaning a true effect or difference is missed.
Q4: Refer to Exhibit 19-2.The mean and the
Q7: A variable that cannot be measured in
Q9: The upper and lower control limits of
Q17: Refer to Exhibit 19-2.The test statistic based
Q38: What is the forecast for July based
Q46: The value of F<sub>.05</sub> with 8 numerator
Q48: In a multiple regression model,the error
Q48: Refer to Exhibit 11-2.The test statistic is<br>A)1.50<br>B)0.67<br>C)1.56<br>D)2.25
Q49: A regression analysis was applied in
Q86: In a multiple regression analysis involving 12