Multiple Choice
Exhibit 16-2
In a regression model involving 30 observations, the following estimated regression equation was obtained. 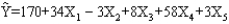 For this model, SSR = 1,740 and SST = 2,000.
-Refer to Exhibit 16-2. The p-value for testing the significance of the regression model is
Definitions:
Related Questions
Q3: The following is part of the
Q12: For four populations,the population variances are assumed
Q19: A sample selected in such a manner
Q60: A measure of goodness of fit for
Q61: If the coefficient of correlation is a
Q71: A test to determine whether or not
Q83: In a regression analysis if SST =
Q88: Refer to Exhibit 13-1.The test statistic to
Q99: An ANOVA procedure is used for data
Q125: Refer to Exhibit 14-8.The Y intercept is<br>A)-0.667<br>B)0.667<br>C)100<br>D)-100