You have collected data from Major League Baseball (MLB)to find the determinants of winning. You have a general idea that both good pitching and strong hitting are needed to do well. However, you do not know how much each of these contributes separately. To investigate this problem, you collect data for all MLB during 1999 season. Your strategy is to first regress the winning percentage on pitching quality ("Team ERA"), second to regress the same variable on some measure of hitting ("OPS - On-base Plus Slugging percentage"), and third to regress the winning percentage on both.
Summary of the Distribution of Winning Percentage, On Base plus Slugging Percentage,
and Team Earned Run Average for MLB in 1999 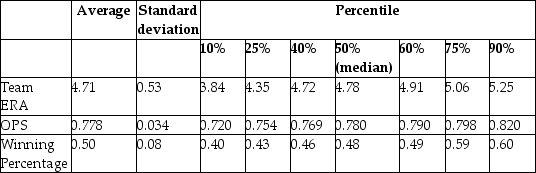 The results are as follows: = 0.94 - 0.100 × teamera, R2 = 0.49, SER = 0.06.
(0.08)(0.017) = -0.68 + 1.513 × ops, R2=0.45, SER = 0.06.
(0.17)(0.221) = -0.19 - 0.099 × teamera + 1.490 × ops, R2=0.92, SER = 0.02.
(0.08)(0.008)(0.126)
(a)Use the t-statistic to test for the statistical significance of the coefficient.
(b)There are 30 teams in MLB. Does the small sample size worry you here when testing for significance?
Definitions:
Q1: The table accompanying lists the joint
Q1: Including an interaction term between two
Q4: With heteroskedastic errors, the weighted least squares
Q7: A pattern in the coefficients of the
Q11: A repeated cross-sectional data set<br>A)is also referred
Q11: The following is not an appropriate way
Q32: Explain carefully why testing joint hypotheses simultaneously,
Q47: In panel data, the regression error<br>A)is likely
Q67: Consistency for the sample average
Q91: What is the quark structure of a