You have learned that earnings functions are one of the most investigated relationships in economics. These typically relate the logarithm of earnings to a series of explanatory variables such as education, work experience, gender, race, etc.
(a)Why do you think that researchers have preferred a log-linear specification over a linear specification? In addition to the interpretation of the slope coefficients, also think about the distribution of the error term.
(b)To establish age-earnings profiles, you regress ln(Earn)on Age, where Earn is weekly earnings in dollars, and Age is in years. Plotting the residuals of the regression against age for 1,744 individuals looks as shown in the figure: 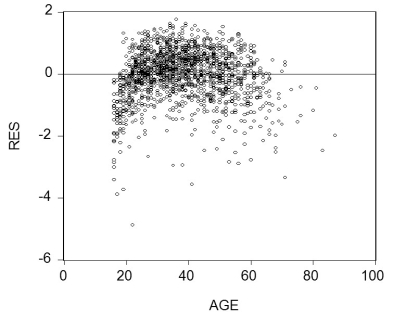 Do you sense a problem?
(c)You decide, given your knowledge of age-earning profiles, to allow the regression line to differ for the below and above 40 years age category. Accordingly you create a binary variable, Dage, that takes the value one for age 39 and below, and is zero otherwise. Estimating the earnings equation results in the following output (using heteroskedasticity-robust standard errors):
Sketch both regression lines: one for the age category 39 years and under, and one for 40 and above. Does it make sense to have a negative sign on the Age coefficient? Predict the ln(earnings)for a 30 year old and a 50 year old. What is the percentage difference between these two?
(d)The F-statistic for the hypothesis that both slopes and intercepts are the same is 124.43. Can you reject the null hypothesis?
(e)What other functional forms should you consider?
Definitions:
Interest Payment
The payment made to a lender by a borrower for the privilege of borrowing money, typically part of the return on a loan or bond.
Cash Dividend
A payment made by a company out of its profits to shareholders, usually in the form of cash.
Interest Paid
The total amount of interest expenses a borrower has paid over a certain period to lenders for the use of borrowed funds.
Dividends Paid
The part of a corporation's profits paid out to its shareholders, typically as cash or more stocks.
Q4: The interpretation of the coefficients in a
Q14: Looking at a large CPS data set
Q16: A subsample from the Current Population
Q17: The following does not represent a threat
Q38: Consider the following regression line:
Q38: The accompanying table shows the joint
Q41: The probability of an event A
Q44: (Requires Matrix Algebra)The population multiple regression
Q45: You have learned in one of
Q49: In the case of a simple