The figure shows is a plot and a fitted linear regression line of the age-earnings profile of 1,744 individuals, taken from the Current Population Survey. 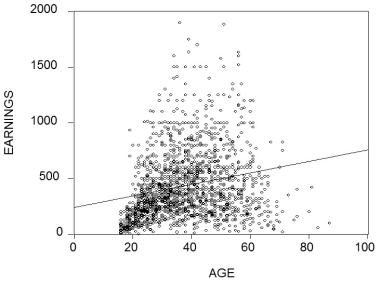 (a)Describe the problems in predicting earnings using the fitted line. What would the pattern of the residuals look like for the age category under 40?
(b)What alternative functional form might fit the data better?
(c)What other variables might you want to consider in specifying the determinants of earnings?
Definitions:
Business Tax Returns
Official documents filed with a government body, detailing a business's income, expenses, and taxes owed for a specific fiscal period.
Sole Proprietorships
A business structure where a single individual owns and runs the business, responsible for all its debts and liabilities.
Partnerships
A business structure where two or more individuals manage and operate a business in accordance with the terms and objectives set out in a Partnership Agreement.
Small Business
A privately owned corporation, partnership, or sole proprietorship that has fewer employees and less annual revenue than a corporation or regular-sized business.
Q1: Your textbook used a distributed lag
Q6: The accompanying graph <img src="https://d2lvgg3v3hfg70.cloudfront.net/TB5979/.jpg" alt="The accompanying
Q9: In order to make reliable forecasts with
Q19: Your textbook has analyzed simultaneous equation
Q26: Give at least three examples from macroeconomics
Q35: A study of United States and Canadian
Q42: Here are some examples of the
Q45: To study the determinants of growth between
Q47: The estimated logit regression in your
Q160: A _ interacts via the strong interaction.