Your textbook states that correlation of the error term across observations "will not happen if the data are obtained by sampling at random from the population." However, in one famous study of the electric utility industry, the observations were listed by the size of the output level, from smallest to largest. The pattern of the residuals was as shown in the figure. 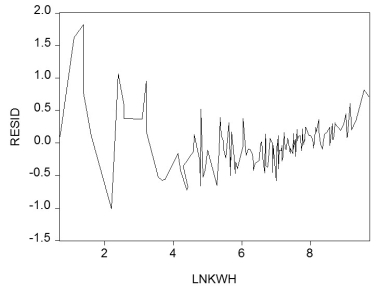 What does this pattern suggest to you?
Definitions:
Q3: (Requires Statistics background beyond Chapters 2
Q8: The correlation between X and Y<br>A)cannot
Q9: In order to make reliable forecasts with
Q30: You set out to forecast the
Q32: The OLS residuals<br>A)can be calculated using the
Q35: The Solow growth model suggests that
Q38: Prove that under the extended least
Q46: The expectations augmented Phillips curve postulates<br>?p
Q56: You have collected data for the
Q67: Consistency for the sample average