Several authors have tried to measure the "persistence" in U.S state unemployment rates by running the following regression: where ur is the state unemployment rate, i is the index for the i-th state, t indicates a time period, and typically k ? 10.
(a)Explain why finding a slope estimate of one and an intercept of zero is typically interpreted as evidence of "persistence."
(b)You collect data on the 48 contiguous U.S. states' unemployment rates and find the following estimates: = 2.25 + 0.60 × ; R2 = 0.40, SER = 0.90
(0.61)(0.13)
Interpret the regression results.
(c)Analyzing the accompanying figure, and interpret the observation for Maryland and for Washington. Do you find evidence of persistence? How would you test for it? 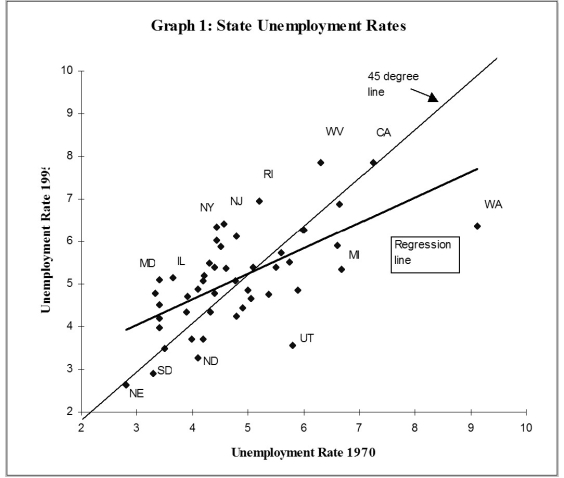 (d)One of your peers points out that this result makes little sense, since it implies that eventually all states would have identical unemployment rates. Explain the argument.
(e)Imagine that state unemployment rates were determined by their natural rates and some transitory shock. The natural rates themselves may be functions of the unemployment insurance benefits of the state, unionization rates of its labor force, demographics, sectoral composition, etc. The transitory components may include state-specific shocks to its terms of trade such as raw material movements and demand shocks from the other states. You specify the i-th state unemployment rate accordingly as follows for the two periods when you observe it, so that actual unemployment rates are measured with error. You have also assumed that the natural rate is the same for both periods. Subtracting the second period from the first then results in the following population regression function: It is not too hard to show that estimation of the observed unemployment rate in period t on the unemployment rate in period (t-k)by OLS results in an estimator for the slope coefficient that is biased towards zero. The formula is Using this insight, explain over which periods you would expect the slope to be closer to one, and over which period it should be closer to zero.
(f)Estimating the same regression for a different time period results in = 3.19 + 0.27 × ; R2 = 0.21, SER = 1.03
(0.56)(0.07)
If your above analysis is correct, what are the implications for this time period?
Definitions:
Evolutionary Trend
A pattern or direction of evolution where a species undergoes gradual changes over time, often resulting in increased complexity or specialization.
Nervous Systems
Complex networks of nerves and cells that transmit signals between different parts of an organism's body to coordinate behavior.
Cerebral Areas
Regions within the brain, each responsible for various functions such as memory, speech, and decision-making.
Temporal Lobes
Region of the cerebrum that contains the auditory areas.
Q4: Comparing the California test scores to test
Q5: Using the model Y = Xβ
Q10: Having more relevant instruments<br>A)is a problem because
Q31: Consider the model Y<sub>i</sub> - β<sub>1</sub>X<sub>i</sub>
Q44: Let Y be a random variable.
Q45: You have decided to use the
Q46: An estimator is<br>A)an estimate.<br>B)a formula that gives
Q47: The estimated logit regression in your
Q47: The two conditions for instrument validity are
Q59: Adult males are taller, on average, than