You collect monthly data on the money supply (M2)for the United States from 1962:1-2002:4 to forecast future money supply behavior. 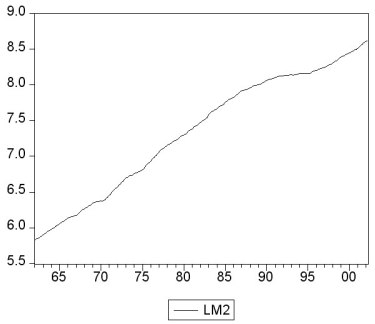
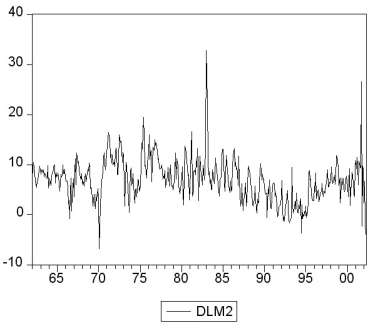 where LM2 and DLM2 are the log level and growth rate of M2.
(a)Using quarterly data, when analyzing inflation and unemployment in the United States, the textbook converted log levels of variables into growth rates by differencing the log levels, and then multiplying these by 400. Given that you have monthly data, how would you proceed here?
(b)How would you go about testing for a stochastic trend in LM2 and DLM2? Be specific about how to decide the number of lags to be included and whether or not to include a deterministic trend in your test. The textbook found the (quarterly)inflation rate to have a unit root. Does this have any affect on your expectation about whether or not the (monthly)money growth rate should be stationary?
(c)You decide to conduct an ADF unit root test for LM2, DLM2, and the change in the growth rate ΔDLM2. This results in the following t-statistic on the parameter of interest. Find the critical value at the 1%, 5%, and 10% level and decide which of the coefficients is significant. What is the alternative hypothesis?
(d)In forecasting the money growth rate, you add lags of the monetary base growth rate (DLMB)to see if you can improve on the forecasting performance of a chosen AR(10)model in DLM2. You perform a Granger causality test on the 9 lags of DLMB and find a F-statistic of 2.31. Discuss the implications.
(e)Curious about the result in the previous question, you decide to estimate an ADL(10,10)for DLMB and calculate the F-statistic for the Granger causality test on the 9 lag coefficients of DLM2. This turns out to be 0.66. Discuss.
(f)Is there any a priori reason for you to be skeptical of the results? What other tests should you perform?
Definitions:
International Dispute Resolution
The process of resolving conflicts between states, organizations, or individuals across national boundaries through negotiated agreements, arbitration, or judicial processes.
Foreign Court's Decision
Judgments or rulings made by a court in one country that may be recognized or enforced in another country's legal system under certain conditions.
Subsidence
The gradual caving in or sinking of an area of land, which can occur due to natural phenomena or human activities.
Excavation
The process of digging or removing earth, typically for the purpose of discovering archaeological remains or for construction.
Q5: Using the model Y = Xβ
Q12: Experimental effects, such as the Hawthorne effect,<br>A)generally
Q14: The two conditions for a valid instrument
Q20: Departures from stationarity<br>A)jeopardize forecasts and inference based
Q32: All of the following are good reasons
Q36: In the basic Keynesian model,to close a
Q38: In the Fixed Effects regression model, you
Q65: In Macroland,currency held by the public is
Q103: In Econland,autonomous consumption equals 200,the marginal propensity
Q149: The portion of planned aggregate expenditure determined