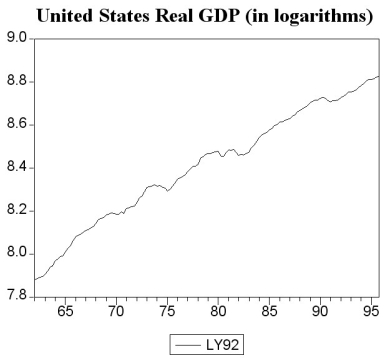
The following two graphs give you a plot of the United States aggregate unemployment rate for the sample period 1962:I to 1999:IV, and the (log)level of real United States GDP for the sample period 1962:I to 1995:IV. You want test for stationarity in both cases. Indicate whether or not you should include a time trend in your Augmented Dickey-Fuller test and why. 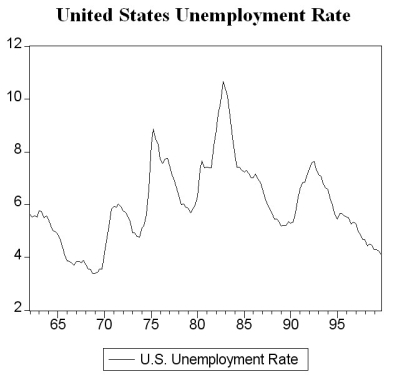
Definitions:
Government Failure
Situations where government intervention in the economy creates inefficiency, leading to a misallocation of resources or failure to achieve intended outcomes.
Rent Seeker
An individual or entity that seeks to increase their own wealth without creating new wealth, often by exploiting control over resources or manipulating regulations.
Rent-seeking Behavior
Activities aimed at increasing one’s share of existing wealth without creating new wealth, often through manipulation or exploitation of the economic environment.
Gasoline Price Supports
Governmental interventions aimed at stabilizing or raising the market price of gasoline through mechanisms like subsidies, taxes, or setting minimum prices to benefit producers.
Q4: When the actual reserve-deposit ratio exceeds the
Q14: Assume that the data looks as
Q18: E(Y | X<sub>1</sub>, ..., X<sub>k</sub>)= Pr(Y =
Q19: You have collected data from Major
Q38: The concepts of exogeneity, strict exogeneity, and
Q40: The main advantage of using panel data
Q42: Consider the standard AR(1)Y<sub>t</sub> = β<sub>0</sub>
Q47: Consider the following population regression function:
Q81: In the basic Keynesian model,to close an
Q190: The effect of a one-unit increase in