Your textbook states that there "are three ways to decide if two variables can plausibly be modeled as cointegrated: use expert knowledge and economic theory, graph the series and see whether they appear to have a common stochastic trend, and perform statistical tests for cointegration. All three ways should be used in practice." Accordingly you set out to check whether (the log of)consumption and (the log of)personal disposable income are cointegrated. You collect data for the sample period 1962:I to 1995:IV and plot the two variables. 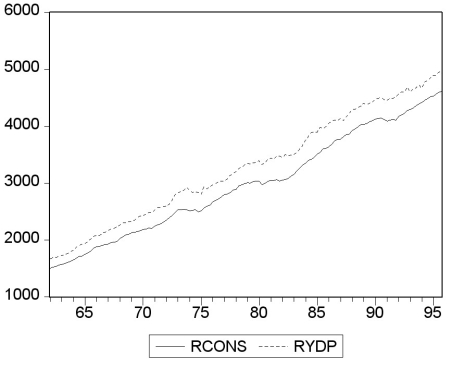 (a)Using the first two methods to examine the series for cointegration, what do you think the likely answer is?
(b)You begin your numerical analysis by testing for a stochastic trend in the variables, using an Augmented Dickey-Fuller test. The t-statistic for the coefficient of interest is as follows: where LnYpd is (the log of)personal disposable income, and LnC is (the log of)real consumption. The estimated equation included an intercept for the two growth rates, and, in addition, a deterministic trend for the level variables. For each case make a decision about the stationarity of the variables based on the critical value of the Augmented Dickey-Fuller test statistic. Why do you think a trend was included for level variables?
(c)Using the first step of the EG-ADF procedure, you get the following result: t = -0.24 + 1.017 lnYpdt
Should you interpret this equation? Would you be impressed if you were told that the regression R2 was 0.998 and that the t-statistic for the slope was 266.06? Why or why not?
(d)The Dickey-Fuller test for the residuals for the cointegrating regressions results in a t-statistic of
(-3.64). State the null and alternative hypothesis and make a decision based on the result.
(e)You want to investigate if the slope of the cointegrating vector is one. To do so, you use the DOLS estimator and HAC standard errors. The slope coefficient is 1.024 with a standard error of 0.009. Can you reject the null hypothesis that the slope equals one?
Definitions:
Managers
Individuals in an organization responsible for directing, controlling, and overseeing the work of others to achieve the organization's goals efficiently and effectively.
Communication Flows
The exchange of information between various levels and parts of an organization or between different organizations.
Managers
Individuals who are responsible for directing and overseeing the work of a group of people in an organization.
Q4: The interpretation of the coefficients in a
Q6: In the simple, one-explanatory variable, errors-in-variables
Q11: Consider a competitive market where the demand
Q24: In the case of heterogeneous causal effects,
Q27: Fiat money refers to<br>A) a one-dollar coin.<br>B)
Q35: Roughly ten percent of elementary schools in
Q42: The money supply in Macroland is currently
Q47: (Requires Appendix material)The long-run, stationary state
Q49: You have a limited dependent variable
Q60: Hyperinflation is caused by rates of _