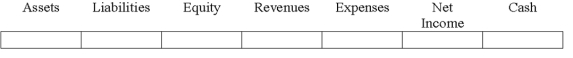
Indicate how each event affects the elements of financial statements.Use the following letters to record your answer in the box shown below each element.You do not need to enter amounts.Enter only one letter for each element.

-The Baker Company purchased an asset on January 1,2016 for $200,000.The asset had a $50,000 salvage value and a 10 year life.The asset was sold on January 1,2018 for $174,000.Show how the sale will affect Baker's financial statements,assuming that Baker uses straight-line depreciation.
Definitions:
Dependent Variable
In an experimental setup, the variable being tested and measured, which is expected to change due to manipulations of the independent variable.
Independent Variable
A variable in an experiment or study that is manipulated or controlled by the researcher to observe its effect on the dependent variable.
Numerical Techniques
Computational algorithms used to solve mathematical problems, including equations, optimizations, and simulations.
Graphical Techniques
Methods used to analyze and visualize data through graphs and charts for better understanding.
Q5: Which of the following shows the effect
Q31: If bonds with a face value of
Q39: Define the terms FIFO and LIFO.
Q54: The primary focus of financial statement audits
Q56: On March 31,2017 Sparkes Co.wrote-off a $400
Q60: Explain the computation of the inventory amount
Q89: Indicate whether each of the following items
Q118: The longer it takes to collect accounts
Q136: On April 30,2016,Midwest Company established a petty
Q156: Unsecured bonds are called:<br>A)discount bonds.<br>B)coupon bonds.<br>C)debenture bonds.<br>D)par