Consider the characteristics of the following three stocks:
The correlation between Thumb Devices and Air Comfort is -0.12.The correlation between Thumb Devices and Sport Garb is 0.89.The correlation between Air Comfort and Sport Garb is -0.85.If you can pick only two stocks for your portfolio,which would you pick? Why?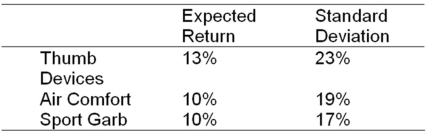
Definitions:
Standard Deviation
A measure of the amount of variation or dispersion of a set of values from the mean.
ACT Type Score
A numerical measurement that represents a student's achievement on the ACT test, which is commonly used for college admissions in the United States.
Normal Curve
A bell-shaped curve that represents the distribution of many types of data where most occurrences take place around the average, and fewer instances occur as you move away from the center.
Standard Deviation
A measure of the dispersion or variability within a set of data points, indicating how much individual data points differ from the mean of the data set.
Q3: Expected Return and Risk Compute the standard
Q13: Which of the following is data that
Q21: Portfolio Return Year to date,Company Y had
Q33: Ultra Petroleum (UPL)has earnings per share of
Q36: Which of the following is most correct?<br>A)When
Q53: Bonds are issued by which of the
Q78: ABC Engineering just purchased a new machine.All
Q81: An all-equity firm is considering the projects
Q112: A new project would require an immediate
Q135: Future and Present Value of an Annuity