The figures below show plots of monthly excess returns for two stocks plotted against excess returns for a market index. 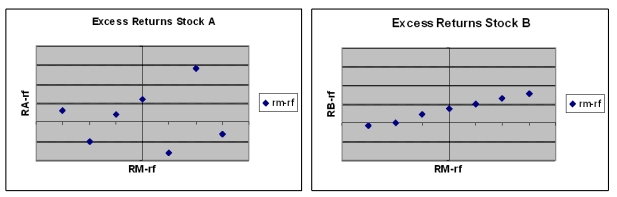
-Which stock is riskier to a non-diversified investor who puts all his money in only one of these stocks?
Definitions:
Forecast Accurately
The process of predicting future events, values, or trends with a high degree of precision.
Unexpected Factors
External or unforeseen elements that can impact outcomes in various contexts, including economic conditions, natural disasters, or social changes.
Corporate Stock
Ownership shares in a corporation, representing a claim on part of the corporation's assets and earnings.
Single Corporation
An individual business entity recognized by law as separate from its owners, possessing rights and responsibilities.
Q12: The CAL provided by combinations of one
Q14: An investor buys a T-bill at a
Q15: The term excess-return refers to _.<br>A) returns
Q29: Assume that both X and Y are
Q40: The difference between balanced funds and asset
Q45: Which of the following is not a
Q57: If interest rates increase,business investment expenditures are
Q57: You have calculated the historical dollar weighted
Q62: _ voting of common stock gives minority
Q64: You purchased 250 shares of common stock