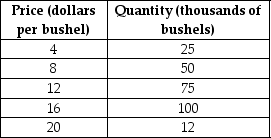
Use the following supply schedule for cherries to draw a graph of the supply curve. Be sure to label the supply curve and each axis, and show each point on the supply curve.
Definitions:
Inverse Demand Function
Represents the relationship between the price of a good and the quantity demanded, showing the maximum price consumers are willing to pay for a specific quantity.
Price Elasticity
A measure of how much the quantity demanded of a good responds to a change in the price of that good, often defined as the percentage change in quantity demanded divided by the percentage change in price.
Grapes
Edible berries, typically growing in clusters on vines, that are used in a variety of products including wine, raisins, and fresh fruit.
Revenue-Maximizing Price
The optimal price of a good or service that maximizes the total revenue for a seller.
Q38: Refer to Table 2-2. Assume Billie's Bedroom
Q38: Suppose that when the price of strawberries
Q65: What is opportunity cost?
Q72: Economic efficiency is defined as a market
Q104: Which of the following are positive economic
Q129: If in the market for peaches, the
Q154: A demand curve that is horizontal indicates
Q173: Consider the following items: a. the album
Q176: Refer to Table 2-2. Assume Billie's Bedroom
Q195: In each of the following situations, list