Figure 3.8 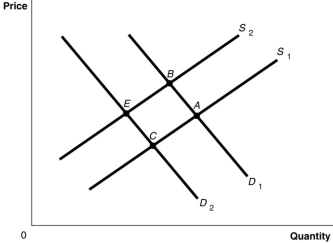
-Refer to Figure 3.8.The graph in this figure illustrates an initial competitive equilibrium in the market for sugar at the intersection of D1 and S2 (point B) . If there is a decrease in the price of fertilizer used on sugar cane and there is a decrease in tastes for sugar-sweetened soft drinks, how will the equilibrium point change?
Definitions:
Sellers
Individuals or entities that offer goods or services for sale in the marketplace.
Equilibrium Price
The price at which the quantity of goods demanded equals the quantity of goods supplied.
Excess Demand
Excess demand occurs when the quantity demanded of a product or service exceeds the quantity supplied at the current price, leading to shortages.
Excess Supply
A market situation where the quantity of a good or service offered is greater than the quantity demanded by consumers.
Q13: Refer to Figure 3-8. The graph in
Q40: In cities with rent controls, the actual
Q41: The cross-price elasticity of demand between Coca-Cola
Q70: If the best surgeon in town is
Q96: Automobile manufacturers produce a range of automobiles
Q153: 'Because chips and salsa are complements, an
Q154: Refer to Table 6-1. If Keegan can
Q164: Refer to Table 2-5. What is Barney's
Q175: The demand curve for canned peas is
Q212: Cross-price elasticity of demand is calculated as