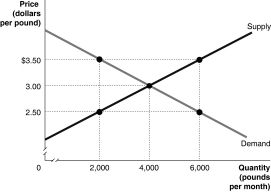
The graph below represents the market for walnuts. Identify the values of the marginal benefit and the marginal cost at the output levels of 2000 pounds, 4000 pounds and 6000 pounds. At each of these output levels, state whether output is inefficiently high, inefficiently low, or economically efficient.
Definitions:
MC
Marginal Cost; the change in total production cost that arises when the quantity produced is incremented by one unit.
Marginal Cost
The cost of producing one additional unit of a product or service, an important concept in economics for decision-making regarding production levels.
Total Variable Costs
The sum of all costs that vary with the level of output, including materials, labor, and other expenses that increase or decrease as production changes.
Natural Monopoly
A market condition where due to high fixed costs or unique resources, a single company can supply a product or service at a lower cost than any potential competitor, thus dominating the market.
Q4: The income effect of an increase in
Q43: Which of the following is evidence of
Q46: Refer to Figure 5-3. What is the
Q94: Which of the following describes how output
Q103: The change in a firm's total cost
Q144: Which of the following is a key
Q185: Shifts in the supply of oil have
Q186: If tolls on a toll road can
Q230: You wish to buy only one CD.
Q230: Which of the following is a fixed