Figure 10.10 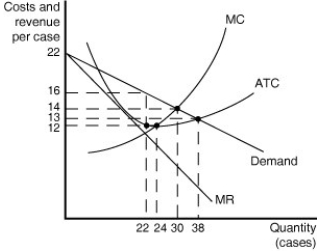 Figure 10.10 shows cost and demand curves for a monopolistically competitive producer of iced tea.
-Refer to Figure 10.10.to answer the following questions.
a.What is the profit-maximising output level?
b.What is the profit-maximising price?
c.At the profit-maximising output level, how much profit will be realised?
d.Does this graph most likely represent the long run or the short run? Why?
__________________________________________________________________________________________________________________________________________________________________________________________
Definitions:
Q9: A cooperative equilibrium results when firms<br>A) choose
Q50: Oligopoly differs from perfect competition and monopolistic
Q81: What is allocative efficiency?<br>A) It refers to
Q108: Although advertising raises the price of a
Q110: Werner & Sons is a manufacturer of
Q199: If a firm's fixed cost exceeds its
Q212: In long-run competitive equilibrium, the perfectly competitive
Q217: What is the trade-off that consumers face
Q236: Refer to Table 9-3. Suppose Julie's marginal
Q260: A price maker is<br>A) a person who