Figure 10.11 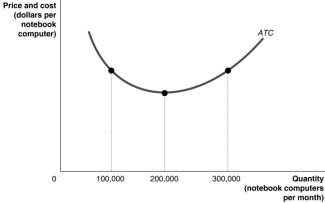
-Refer to Figure 10.11.Suppose the above graph represents the relationship between the average total cost of producing notebook computers and the quantity of notebook computers produced by Dell.On a graph, illustrate the demand, MR, MC, and ATC curves which would represent Dell maximising profits at a quantity of 100 000 per month and identify the area on the graph which represents the profit.
__________________________________________________________________________________________________________________________________________________________________________________________
Definitions:
Q1: Suppose that a perfectly competitive industry becomes
Q3: Holding everything else constant, government approval of
Q87: In a monopolistically competitive market, a successful
Q88: If we use a narrow definition of
Q101: How do the price and quantity of
Q137: In a natural monopoly, throughout the range
Q168: Firms in perfect competition produce the productively
Q215: Consider the following actions undertaken by a
Q216: What is meant by productive efficiency? How
Q260: A price maker is<br>A) a person who