Multiple Choice
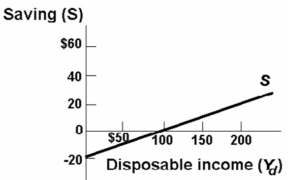
-Refer to the above diagram.The break-even level of disposable income:
Definitions:
Related Questions
Q31: Which of the above diagrams best portrays
Q59: Which of the following is true of
Q72: Which of the diagrams below best portrays
Q80: Refer to the above table.If the equilibrium
Q84: Refer to the above table.The equilibrium real
Q111: The production possibilities curve represents:<br>A) the maximum
Q173: During the recession of 2008 - 2009:<br>A)
Q193: Refer to the above production possibilities curves.Given
Q224: Refer to the above diagram for a
Q230: The linear equation for line (1)on the