Explain the relationship between the aggregate expenditures model in graph (A)below and the aggregate demand model in graph (B)below.In other words,explain how points 1,2,and 3 are related to points 1',2',and 3'.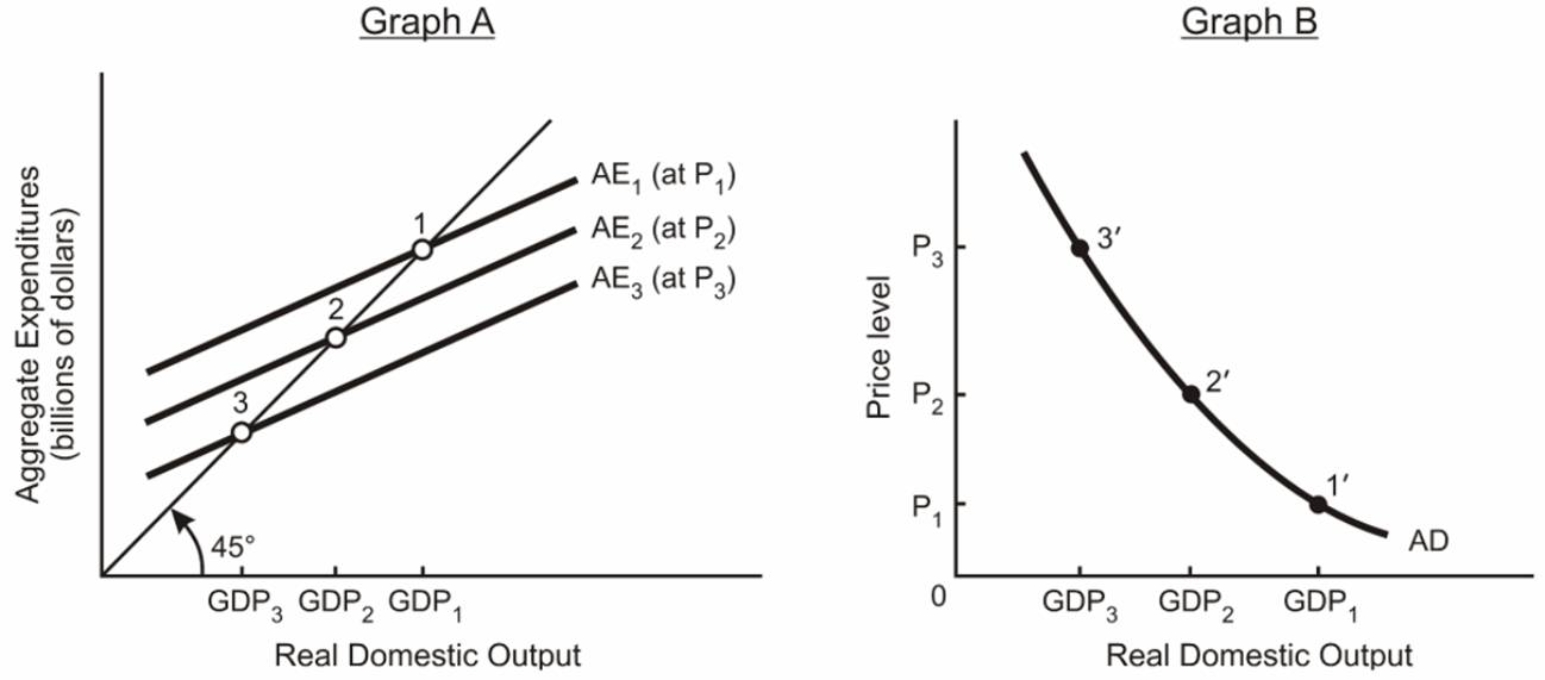
Definitions:
Unemployment
The state of being without a job despite actively looking for work.
Downward-sloping
A term used to describe a graphical representation where a line or curve moves lower as it travels from left to right, indicating a negative relationship between two variables.
Efficiency Wage Model
An economic theory suggesting that higher wages might lead to increased productivity by attracting better employees and increasing worker motivation.
Electronic Devices
Gadgets like smartphones, laptops, and tablets that operate on electrical power and digital information.
Q1: Which are the richest and poorest countries
Q6: Aluminum plants consume huge quantities of electricity
Q8: How does monetary policy affect equilibrium GDP?
Q11: Within the GRI, Economic Standards provide users
Q16: What is inflation targeting and what are
Q17: The Federal government is considering passing an
Q30: Use the data in the following table
Q41: What is meant by the Liquidity Trap?
Q49: Non-monetary assets DO NOT include:<br>A) fixed assets.<br>B)
Q50: Describe the slope of a direct and