The following frequency distribution shows the monthly stock returns for Home Depot for the years 2003 through 2007. 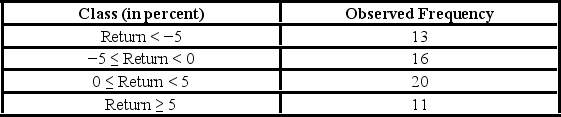 Over the time period, the following summary statistics are provided: Mean = 0.31%, Standard deviation = 6.49%, Skewness = 0.15, and Kurtosis = 0.38. For the goodness-of-fit test for normality, the null and alternative hypothesis are ________.
Definitions:
Q6: The curve representing the regression equation <img
Q11: A recent Health of Boston report suggests
Q13: Although allowing for nonlinear trends, polynomials are
Q17: A recent report claimed that Americans are
Q30: A fund manager wants to know if
Q40: A multiple regression model with two explanatory
Q73: The following scatterplot shows productivity and number
Q75: A professional sports organization is going to
Q87: The owner of a large car dealership
Q106: A researcher analyzes the factors that may