The following table shows the observed frequencies of the quarterly returns for a sample of 60 hedge funds. The table also contains the hypothesized proportions of each class assuming the quarterly returns have a normal distribution. The sample mean and standard deviation are 3.6% and 7.4% respectively. 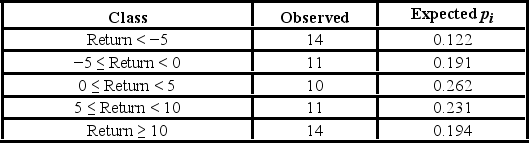 a. Set up the competing hypotheses for the goodness-of-fit test of normality for the quarterly returns.
B) Calculate the value of the test statistic and determine the degrees of freedom.
C) Compute the p-value. Does the evidence suggest that the quarterly returns do not have a normal distribution at the 10% significance level?
Definitions:
Information Needs
The specific data and information required by individuals or organizations to make informed decisions.
Accounting System
A systematic process of recording, summarizing, analyzing, and reporting financial transactions of a business to provide an accurate financial picture.
E-Commerce
Refers to the buying and selling of goods or services using the internet, and the transfer of money and data to execute these transactions.
Subsidiary Ledger
A subsidiary ledger is a group of detailed accounts where their totals tie into and support summary amounts in one or more accounts in the general ledger.
Q14: In a two-way ANOVA test, how many
Q19: A professional baseball player changed his throwing
Q30: We use ANOVA to test for differences
Q33: In the following table, likely voters' preferences
Q53: A market researcher is studying the spending
Q83: For the log-log model ln(y) = β<sub>0</sub>
Q87: Two random samples are considered independent if
Q105: A supermarket has just added a new
Q105: When using Fisher's Least Significant Difference (LSD)
Q110: A university has six colleges and takes