The following table shows the annual revenues (in millions of dollars) of a pharmaceutical company over the period 1990-2011. 
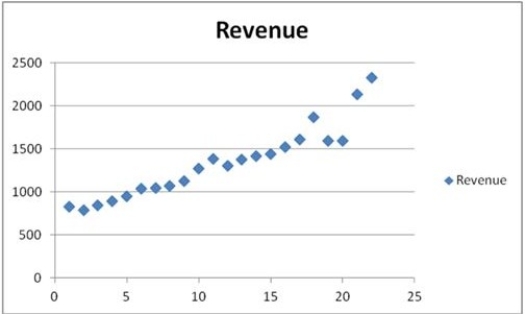 The scatterplot indicates that the annual revenues have an increasing trend. Linear, exponential, quadratic, and cubic models were fit to the data starting with t = 1, and the following output was generated.
  Which of the following is a linear trend equation?
Definitions:
Money Income
The complete sum of money earned by an individual or a household that includes earnings from work, salaries, and additional income sources.
Budget Line
A graphical depiction of all possible combinations of two goods that can be purchased with a given budget and prices.
Price Ratio
The ratio of the prices of two goods or services, often used in the context of trade or barter.
Elasticity of Demand
A measure of how responsive the quantity demanded is to a change in price, indicating how a product's demand will fluctuate with pricing changes.
Q3: For the Wilcoxon signed-rank test with n
Q18: A real estate analyst believes that the
Q27: The _ is a trend model that
Q29: Which of the following is NOT one
Q48: Which of the following regression models is
Q55: If the average price for gasoline in
Q68: Given the following portion of regression results,
Q68: Swaps have little exposure to default risk.
Q100: A shipping company believes there is a
Q115: When confronted with multicollinearity, a good remedy