The following table shows the annual revenues (in millions of dollars) of a pharmaceutical company over the period 1990-2011. 
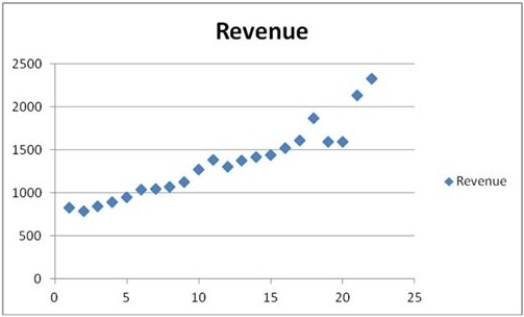 The scatterplot indicates that the annual revenues have an increasing trend. Linear, exponential, quadratic, and cubic models were fit to the data starting with t = 1, and the following output was generated.
  Which of the following is a revenue forecast for 2012 found by the polynomial trend equation with the best fit?
Definitions:
Q11: Consider the following simple linear regression model:
Q23: A magician has a coin that may
Q40: A realtor wants to predict and compare
Q44: The following table shows the annual revenues
Q55: The following data for five years of
Q70: An option holder can perform each of
Q70: How many coefficients need to be estimated
Q81: Because both the Laspeyres and Paasche indices
Q90: A medical researcher is interested in assessing
Q107: The _ equation is a theoretical relationship