The following table shows the annual revenues (in millions of dollars) of a pharmaceutical company over the period 1990-2011. 
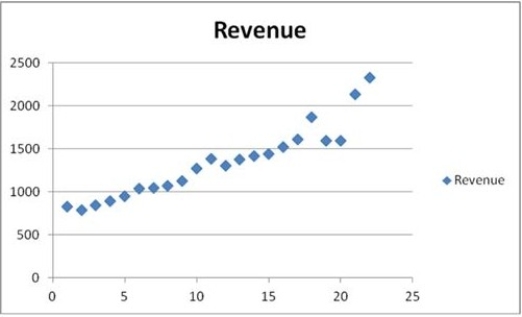 The scatterplot indicates that the annual revenues have an increasing trend. Linear, exponential, quadratic, and cubic models were fit to the data starting with t = 1, and the following output was generated.
  Which of the following is the revenue forecast for 2013 found by the trend regression equation with the best fit?
Definitions:
Performance
Performance refers to the act of carrying out or accomplishing an action, task, or function.
Negotiation Stage
A phase in the negotiation process where parties discuss, propose, and approach mutual agreement.
Interests
Specific topics or activities that capture an individual's attention, curiosity, or concern, often leading to engagement or investment in those areas.
Implementation
The process of putting a decision or plan into effect; execution.
Q9: For the exponential model ln(y) = β<sub>0</sub>
Q11: A dummy variable is also called an
Q28: If today were the expiry date, would
Q44: The following table shows the annual revenues
Q62: An index number is an easy-to-interpret numerical
Q68: An option seller can avoid a loss
Q72: One equity option contract traded on the
Q72: Cross-currency swaps do NOT involve:<br>A)The exchange of
Q95: A fund manager wants to know if
Q122: Which of the following is a similarity