The following table shows the annual revenues (in millions of dollars) of a pharmaceutical company over the period 1990-2011. 
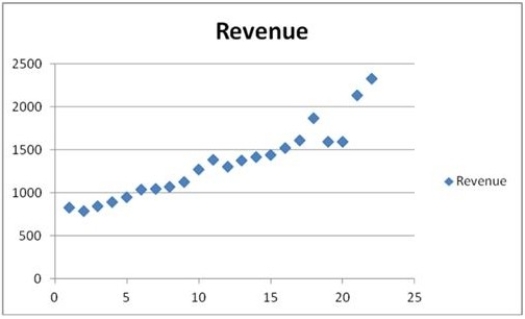 The scatterplot indicates that the annual revenues have an increasing trend. Linear, exponential, quadratic, and cubic models were fit to the data starting with t = 1, and the following output was generated.
  Which of the following is the revenue forecast for 2012 found by the linear trend equation?
Definitions:
Fiscal Policy
Government strategies to influence a country's economy through public spending and taxation decisions.
Monetary Policy
The process by which the central bank of a country controls the supply of money, often targeting an inflation rate or interest rate to ensure price stability and general trust in the currency.
United States Government Budget
The budget prepared by the federal government, outlining its projected revenues and expenditures for the forthcoming fiscal year.
Fiscal Year
A one-year period used by governments and businesses for accounting and budget purposes, which may not align with the calendar year.
Q34: Joanna Robertson bought a share of XYZ
Q46: When the expected inflation rate is relatively
Q50: Index numbers provide direct comparisons of prices
Q58: When the increase in the series gets
Q61: All swaps require quarterly cash settlements.
Q85: A bull spread is a more aggressive
Q88: If the confidence interval does not contain
Q93: The following scatterplot shows productivity and number
Q111: A marketing analyst wants to examine the
Q118: For the quadratic regression equation <img src="https://d2lvgg3v3hfg70.cloudfront.net/TB6618/.jpg"