The following table shows the annual revenues (in millions of dollars) of a pharmaceutical company over the period 1990-2011. 
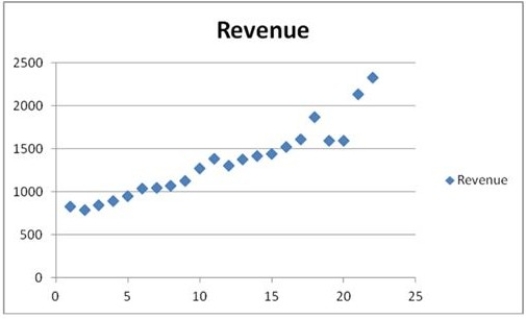 The scatterplot indicates that the annual revenues have an increasing trend. Linear, exponential, quadratic, and cubic models were fit to the data starting with t = 1, and the following output was generated.
  Which of the following is a revenue forecast for 2012 found by the exponential trend equation?
Definitions:
Probability
A measure of the likelihood that an event will occur, quantified between 0 and 1, where 0 indicates impossibility and 1 indicates certainty.
Null Hypothesis
A type of hypothesis used in statistics that suggests there is no significant difference or effect in a particular condition, serving as a default position until evidence suggests otherwise.
P < .05
A statistical threshold indicating that the probability of observing the obtained result, or more extreme, if the null hypothesis is true, is less than 5%.
T-test
A statistical test used to compare the means of two groups or test a single mean against a known value.
Q5: Which of the following is true about
Q10: Typically, the sales volume declines with an
Q39: The following data show the demand for
Q41: Dealers and brokers both play a role
Q44: Rita Jacob purchased a corporate bond at
Q48: If the regression framework is used to
Q59: The following table provides the values of
Q63: A researcher analyzes the factors that may
Q77: The following data, with the corresponding Excel
Q104: Thirty employed single individuals were randomly selected