Multiple Choice
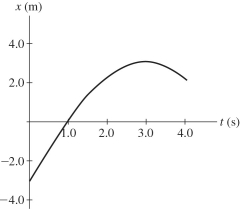
The graph in the figure shows the position of a particle as it travels along the x-axis. What is the magnitude of the average speed of the particle between t = 1.0 s and t = 4.0 s? 
Definitions:
Related Questions
Q21: The International Space Station is orbiting at
Q30: A majorette fastens two batons together at
Q38: A 1000-kg barge is being towed by
Q48: The graph in the figure shows the
Q71: A satellite of mass M takes time
Q77: Two horizontal curves on a bobsled
Q88: A person on a diet loses
Q130: The graph in the figure shows the
Q163: When is the average velocity of an
Q180: A ball thrown horizontally from a point