The graph in the figure shows the velocity of a particle as it travels along the x-axis. (a) In what direction (+x or -x) is the acceleration at t = 0.5 s?
(b) In what direction (+x or -x) is the acceleration at t = 3.0 s?
(c) What is the average acceleration of the particle between t = 2.0 s and t = 4.0 s?
(d) At what value of t is the instantaneous acceleration equal to 0 m/s2? 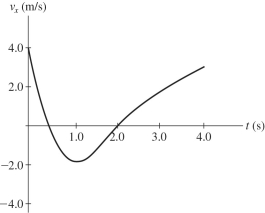
Definitions:
Global/Specific
Pertains to general or worldwide aspects when used in the context of 'global,' whereas 'specific' refers to particular, detailed instances or examples.
Internal/External
Terms related to the sources of influence or causes; internal refers to factors within a person, while external refers to factors outside of an individual.
Women's Biological
A term potentially incomplete but could refer to the biological aspects distinct to women, including reproductive functions and hormonal makeup.
Rates of Divorce
Statistical measures that represent the frequency of divorce within a population over a specific period of time.
Q16: Enzo throws a rock horizontally with a
Q25: Two planets have the same surface
Q33: A 15-kg block is on a frictionless
Q35: A racquetball strikes a wall with a
Q42: The following conversion equivalents are given: 1.0
Q59: If you pound a feather with a
Q62: Two small objects, with masses m and
Q66: A car moving at a steady 10
Q73: The sum of two vectors of fixed
Q166: The components of vectors <span