The figure shows a graph of the position of a moving object as a function of time. What is the velocity of the object at each of the following times?
(a) At t = 1.0 s
(b) At t = 2.5 s
(c) At t = 4.0 s
(d) At t = 5.5 s 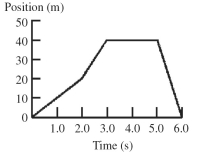
Definitions:
Liquidity
The ease with which an asset can be converted into cash without affecting its market price.
Current Ratio
Current assets divided by current liabilities.
Inventory Turnover
Sales divided by total inventory.
Q12: The figure shows four vectors,
Q13: Two perpendicular vectors, <span class="ql-formula"
Q24: An oak tree was planted
Q35: A racquetball strikes a wall with a
Q37: The figure shows an acceleration-versus-force graph for
Q59: In the figure, a weightlifter's barbell consists
Q62: A machinist turns on the power
Q65: An object slides on a level floor.
Q70: You are driving at <span
Q75: The king's chamber of the great pyramid