Short Answer
The graph shown in the figure shows the results of measurements of the dc current through a circuit device for various potential differences across it. Assume that all the numbers shown are accurate to two significant figures. What is the resistance of this device? 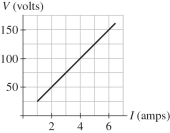
Definitions:
Related Questions
Q10: An image is 4.0 mm in front
Q26: When an initially uncharged capacitor is charged
Q34: A circular coil of 20 turns
Q35: When current is flowing in an ordinary
Q44: A compound microscope has an objective with
Q72: Draw a circuit with two batteries, a
Q76: A plastic rod is charged up by
Q97: The focal length of the objective lens
Q117: The electron-volt is a unit of<br>A) charge.<br>B)
Q131: An object is placed near a concave