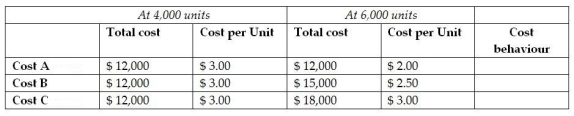
The following chart shows three different costs: Cost A,Cost B,Cost C.For each cost,the chart shows the total cost and cost per unit at two different volumes within the same relevant range.Based on this information,identify each cost as fixed,variable or mixed.
Definitions:
Profitability Index
A financial metric that calculates the relationship between the present value of future cash flows and the initial investment cost.
Preference Rule
A guideline or rule that prioritizes alternatives based on certain criteria, often used in decision-making processes.
Nominal Cost
The cost expressed in current monetary terms without adjustment for inflation, often contrasted with real cost.
Expected Inflation
The anticipated rate at which the general level of prices for goods and services will rise over a period.
Q15: Value-engineering is accomplished by eliminating,reducing,or simplifying all
Q37: Conversion costs include direct labour and direct
Q39: What are three methods used to estimate
Q58: The "total physical units to account for"
Q95: How many units must be sold to
Q169: In Step 1 of the process costing
Q209: ABC produces ping-pong balls using a three-step
Q240: Regression analysis uses only two of the
Q258: Under variable costing,fixed manufacturing costs are treated
Q310: What would the contribution margin be at