Examlex

Solved

Instruction 12  Regression statistics \text { Regression statistics }  ANOVA \text { ANOVA }

question 95

True/False

Instruction 12.25
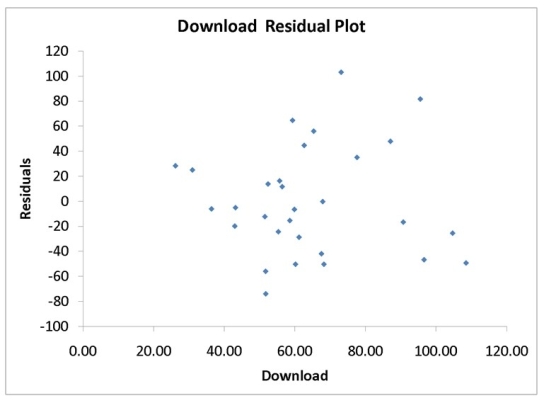
A computer software developer would like to use the number of downloads (in thousands) for the trial version of his new shareware to predict the amount of revenue (in thousands of dollars) he can make on the full version of the new shareware. Following is the output from a simple linear regression along with the residual plot and normal probability plot obtained from a data set of 30 different sharewares that he has developed:
 Regression statistics \text { Regression statistics }
 MultipleR 0.8691 R Square 0.7554 Adjusted R  Square 0.7467 Standard Error 44.4765 Observations 30.0000\begin{array}{|l|l|}\hline \text { MultipleR } & 0.8691 \\\hline \text { R Square } & 0.7554 \\\hline \begin{array}{l}\text { Adjusted R } \\\text { Square }\end{array} & 0.7467 \\\hline \text { Standard Error } & 44.4765 \\\hline \text { Observations } & 30.0000\\\hline \end{array}

 ANOVA \text { ANOVA }
dfSSMSF Significance F Regression 1171062.9193171062.919386.47590.0000 Residual 2855388.43091978.1582 Total 29226451.3503\begin{array}{|l|l|l|l|l|l|}\hline & d f & S S & M S & F & \begin{array}{l}\text { Significance } \\F\end{array} \\\hline \text { Regression } & 1 & 171062.9193 & 171062.9193 & 86.4759 & 0.0000 \\\hline \text { Residual } & 28 & 55388.4309 & 1978.1582 & & \\\hline \text { Total } & 29 & 226451.3503 & & & \\\hline\end{array}

 Coefficients  Standard  Error  t Stat p-value  Lower 95%  Upper 95%  Intercept 95.061426.91833.53150.0015150.200939.9218 Download 3.72970.40119.29920.00002.90824.5513\begin{array}{|l|l|l|l|l|l|l|}\hline & \text { Coefficients } & \begin{array}{l}\text { Standard } \\\text { Error }\end{array} & \text { t Stat } & p \text {-value } & \text { Lower 95\% } & \text { Upper 95\% } \\\hline \text { Intercept } & -95.0614 & 26.9183 & -3.5315 & 0.0015 & -150.2009 & -39.9218 \\\hline \text { Download } & 3.7297 & 0.4011 & 9.2992 & 0.0000 & 2.9082 & 4.5513 \\\hline\end{array}


 Instruction 12.25 A computer software developer would like to use the number of downloads (in thousands) for the trial version of his new shareware to predict the amount of revenue (in thousands of dollars) he can make on the full version of the new shareware. Following is the output from a simple linear regression along with the residual plot and normal probability plot obtained from a data set of 30 different sharewares that he has developed:   \text { Regression statistics }   \begin{array}{|l|l|} \hline \text { MultipleR } & 0.8691 \\ \hline \text { R Square } & 0.7554 \\ \hline \begin{array}{l} \text { Adjusted R } \\ \text { Square } \end{array} & 0.7467 \\ \hline \text { Standard Error } & 44.4765 \\ \hline \text { Observations } & 30.0000\\ \hline  \end{array}    \text { ANOVA }   \begin{array}{|l|l|l|l|l|l|} \hline & d f & S S & M S & F & \begin{array}{l} \text { Significance } \\ F \end{array} \\ \hline \text { Regression } & 1 & 171062.9193 & 171062.9193 & 86.4759 & 0.0000 \\ \hline \text { Residual } & 28 & 55388.4309 & 1978.1582 & & \\ \hline \text { Total } & 29 & 226451.3503 & & & \\ \hline \end{array}    \begin{array}{|l|l|l|l|l|l|l|} \hline & \text { Coefficients } & \begin{array}{l} \text { Standard } \\ \text { Error } \end{array} & \text { t Stat } & p \text {-value } & \text { Lower 95\% } & \text { Upper 95\% } \\ \hline \text { Intercept } & -95.0614 & 26.9183 & -3.5315 & 0.0015 & -150.2009 & -39.9218 \\ \hline \text { Download } & 3.7297 & 0.4011 & 9.2992 & 0.0000 & 2.9082 & 4.5513 \\ \hline \end{array}         -Referring to Instruction 12.25,there appears to be autocorrelation in the residuals.  Instruction 12.25 A computer software developer would like to use the number of downloads (in thousands) for the trial version of his new shareware to predict the amount of revenue (in thousands of dollars) he can make on the full version of the new shareware. Following is the output from a simple linear regression along with the residual plot and normal probability plot obtained from a data set of 30 different sharewares that he has developed:   \text { Regression statistics }   \begin{array}{|l|l|} \hline \text { MultipleR } & 0.8691 \\ \hline \text { R Square } & 0.7554 \\ \hline \begin{array}{l} \text { Adjusted R } \\ \text { Square } \end{array} & 0.7467 \\ \hline \text { Standard Error } & 44.4765 \\ \hline \text { Observations } & 30.0000\\ \hline  \end{array}    \text { ANOVA }   \begin{array}{|l|l|l|l|l|l|} \hline & d f & S S & M S & F & \begin{array}{l} \text { Significance } \\ F \end{array} \\ \hline \text { Regression } & 1 & 171062.9193 & 171062.9193 & 86.4759 & 0.0000 \\ \hline \text { Residual } & 28 & 55388.4309 & 1978.1582 & & \\ \hline \text { Total } & 29 & 226451.3503 & & & \\ \hline \end{array}    \begin{array}{|l|l|l|l|l|l|l|} \hline & \text { Coefficients } & \begin{array}{l} \text { Standard } \\ \text { Error } \end{array} & \text { t Stat } & p \text {-value } & \text { Lower 95\% } & \text { Upper 95\% } \\ \hline \text { Intercept } & -95.0614 & 26.9183 & -3.5315 & 0.0015 & -150.2009 & -39.9218 \\ \hline \text { Download } & 3.7297 & 0.4011 & 9.2992 & 0.0000 & 2.9082 & 4.5513 \\ \hline \end{array}         -Referring to Instruction 12.25,there appears to be autocorrelation in the residuals.
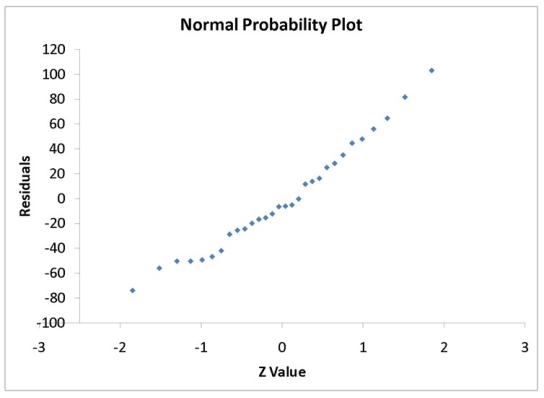
-Referring to Instruction 12.25,there appears to be autocorrelation in the residuals.

Analyze the impact of opportunity costs in the production of goods.
Understand the implications of economic growth and technological advancements on the PPF.
Grasp the significance of efficiency and resource allocation in an economy.
Comprehend how changes in unemployment affect the economy's production capabilities.

Definitions:

Strategizing

The process of defining a company's strategy or direction and making decisions on allocating its resources to pursue this strategy.

Scenario Analysis

A process of analyzing possible future events by considering alternative possible outcomes, often used in strategic planning to make flexible long-term plans.

Forecasting Data

The use of historical data and analysis to make informed predictions about future trends, sales, demands, or other metrics.

Scenario Analysis

A method of evaluating potential future occurrences through the exploration of different potential outcomes or situations.

Related Questions