Instruction 13.17
A microeconomist wants to determine how corporate sales are influenced by capital and wage spending by companies. She proceeds to randomly select 26 large corporations and record information in millions of dollars. The Microsoft Excel output below shows results of this multiple regression.
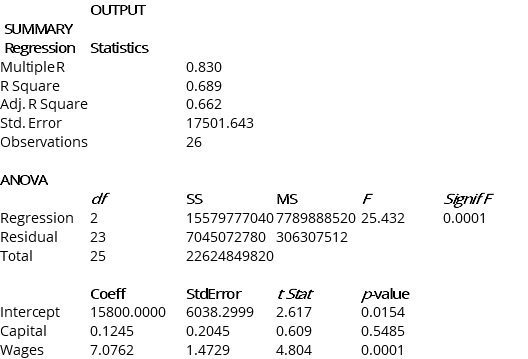 Note: Adj. R Square = Adjusted R Square; Std. Error = Standard Error
-Referring to Instruction 13.17,when the microeconomist used a simple linear regression model with sales as the dependent variable and wages as the independent variable,he obtained an r2 value of 0.601.What additional percentage of the total variation of sales has been explained by including capital spending in the multiple regression?
Definitions:
Demand Curve
A graph showing the relationship between the price of a good or service and the quantity demanded for a given period.
Short-Run Equilibrium
Short-run equilibrium occurs when in a market, the quantity supplied equals the quantity demanded at the current price, before any long-term adjustments are made.
MR > MC
A situation in marginal analysis where the marginal revenue (MR) exceeds the marginal cost (MC), suggesting a potential increase in profitability by expanding production.
P > ATC
A scenario in which the price of a good is greater than the average total cost of producing that good, indicating potential profitability for the firm.
Q6: Referring to Instruction 14-9,the estimate of the
Q33: Referring to Instruction 11-12,the mean square for
Q46: Referring to Instruction 12.33,the degrees of freedom
Q101: Referring to Instruction 13.13,the estimate of the
Q122: A multiple regression is called 'multiple' because
Q129: A second-order autoregressive model for average mortgage
Q133: Variance inflationary factor (VIF)states the degree to
Q143: Referring to Instruction 14-15,plot both the number
Q192: Referring to Instruction 12.10,predict the revenue when
Q224: Referring to Instruction 13.28,one company in the