The graph in the figure shows the x component of the acceleration of a 2.4-kg object as a function of time (in ms). 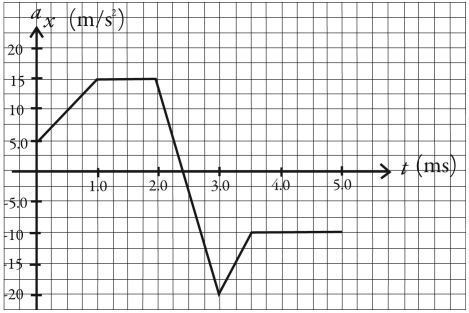 (a)At what time(s)does the x component of the net force on the object reach its maximum magnitude,and what is that maximum magnitude?
(b)What is the x component of the net force on the object at time  and at
  ?
?
Definitions:
Tax Deductible
Refers to expenses that can be subtracted from gross income to determine taxable income, thereby reducing the overall tax liability.
Interest Expense
The cost incurred by an entity for borrowed funds, including loans, bonds, or lines of credit.
Debt-to-Equity Ratio
It's a ratio that signifies the proportional use of debt and shareholders' equity in the acquisition of company assets.
Total Liabilities
The sum of all financial obligations (debts and other liabilities) that a company owes to outside parties.
Q2: Consider the following data for Dodger
Q7: Studies show that stocks with high dividend
Q10: Two objects are thrown from the top
Q15: A 1.2-kg spring-activated toy bomb slides on
Q24: You believe that Beta Alpha Watch Company
Q36: If the eastward component of vector <img
Q56: Two bodies P and Q on a
Q58: The velocity of an object as a
Q62: The current definition of the standard kilogram
Q99: You are the CFO of a small