Figure 3-8 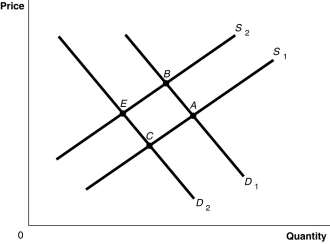
-Refer to Figure 3-8.The graph in this figure illustrates an initial competitive equilibrium in the market for sugar at the intersection of D1 and S2 (pointB) If there is a decrease in the price of fertiliser used on sugar cane and there is a decrease in tastes for sugar-sweetened soft drinks, how will the equilibrium point change?
Definitions:
Price
The amount of money required to purchase a good or service, reflecting its value in the marketplace.
Deadweight Loss
A loss of economic efficiency that can occur when the equilibrium for a good or a service is not achieved or is not achievable.
Perfectly Competitive
A market structure characterized by many buyers and sellers, homogeneous products, and free entry and exit from the market.
Consumer Surplus
The difference between the total amount that consumers are willing and able to pay for a good or service and the total amount that they actually pay.
Q28: Refer to Figure 2.7.What is the opportunity
Q56: If there is a market outcome in
Q64: What is comparative advantage? What is absolute
Q66: An inferior good is a good for
Q84: Studies have shown links between calcium consumption
Q101: The payment received by suppliers of entrepreneurial
Q106: A grocery store sells a bag of
Q162: The income effect of a price change
Q206: If,in the market for oranges,the supply has
Q234: In each of the following situations,list what