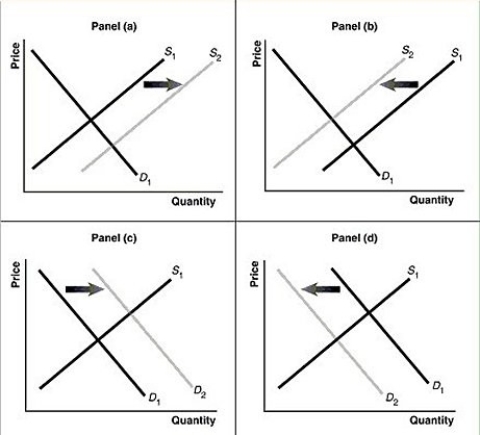
Figure 3-7

-Refer to Figure 3-7.Assume that the graphs in this figure represent the demand and supply curves for used clothing, an inferior good.Which panel describes what happens in this market as a result of a decrease in income?
Definitions:
Leisure Time
Free time spent away from work, chores, and other obligatory activities, often for relaxation, entertainment, or hobbies.
Interactive Media
Digital systems and services that respond to user inputs, allowing for real-time communication, engagement, and manipulation of data or content.
Emotional Responses
The feelings and reactions that emerge in response to stimuli, reflecting an individual's psychological state.
Social Disorganization
A problem in distressed communities that includes weak social cohesion (lack of trust and connection among community members), poor neighborhood climate (fear related to crime and violence), and perceived racism.
Q8: Refer to Figure 5.5.Suppose that instead of
Q58: Allocative efficiency occurs when every good or
Q90: A surplus occurs when the actual selling
Q92: Draw a supply and demand graph showing
Q100: The excess burden of a tax is
Q141: What is true about the slope of
Q159: Refer to Figure 5.7.The price buyers pay
Q167: Paul goes to Sportsmart to buy a
Q173: Entrepreneurs bring together the factors of production
Q187: If the price of steel increases drastically,the