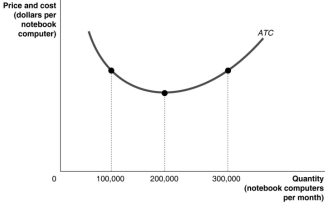
Figure 9.11 
-Refer to Figure 9.11.Suppose the above graph represents the relationship between the average total cost of producing notebook computers and the quantity of notebook computers produced by Dell.On a graph,illustrate the demand,MR,MC,and ATC curves which would represent Dell maximising profits at a quantity of 100 000 per month and identify the area on the graph which represents the profit.
__________________________________________________________________________________________________________________________________________________________________________________________
Definitions:
Semantics
Semantics studies the meaning of words, phrases, and sentences in language.
Grammar
The system of rules governing the structure and use of a language.
Pragmatics
Aspects of language involving the practical ways of communicating with others, or the social “niceties” of language.
Language
A system of symbols and rules used for communication and thought among individuals within a community.
Q21: If,for a given output level,a perfectly competitive
Q23: Which of the following is true in
Q31: One way by which firms differentiate their
Q49: Companies often find it to be more
Q62: Refer to Table 9.3.Does Alistair have a
Q74: If you own a $1000 face value
Q144: The term 'trust' in antitrust refers to
Q185: The total amount of copper in the
Q245: What is one difference between the labour
Q319: There is much evidence to suggest that