Figure 9.11 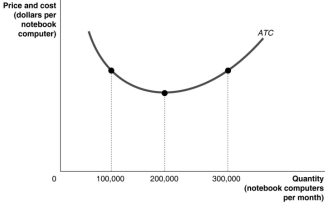
-Refer to Figure 9.11.Suppose the above graph represents the relationship between the average total cost of producing notebook computers and the quantity of notebook computers produced by Dell.On a graph,illustrate the demand,MR,MC,and ATC curves which would represent Dell maximising profits at a quantity of 100 000 per month and identify the area on the graph which represents the profit.
__________________________________________________________________________________________________________________________________________________________________________________________
Definitions:
Exchange
The process by which two or more parties trade goods, services, or other values to the mutual benefit of both or all.
Information
Data that is processed, organized, structured, or presented in a given context to make it meaningful or useful.
Competitive Advantage
A condition or circumstance that puts a company in a favorable or superior business position compared to its competitors.
Pricing
The process of determining the value or amount charged for a product or service.
Q32: Refer to Figure 10.3.The panel in the
Q35: Suppose a competitive firm is paying a
Q79: Refer to Table 9.2.Which of the following
Q137: Which of the following statements is consistent
Q146: A monopsony is a term used to
Q151: Why does a monopoly cause a deadweight
Q159: The primary purpose of labour unions is
Q210: Suppose a competitive firm is paying a
Q247: If a dollar a year from now
Q250: What characteristic of a competitive market has