Table 9.2 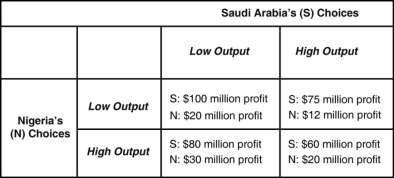 Suppose OPEC has only two producers, Saudi Arabia and Nigeria. Saudi Arabia has far more oil reserves and is the lower cost producer compared to Nigeria. The payoff matrix in Table 9.2 shows the profits earned per day by each country. 'Low output' corresponds to producing the OPEC assigned quota and 'high output' corresponds to producing the maximum capacity beyond the assigned quota.
-Refer to Table 9.2.The Nash equilibrium in this game is:
Definitions:
Q39: Refer to Figure 8.3.Suppose the monopolist represented
Q56: Compared to a perfectly competitive firm,the demand
Q73: In a competitive market equilibrium,<br>A) total consumer
Q114: Long-run economic profits would most likely exist
Q121: At low wages,the labour supply curve for
Q220: Refer to Figure 9.14.The profit-maximising output level
Q228: In the long run,if the demand curve
Q231: Refer to Figure 11.1.The figure above represents
Q293: Refer to Figure 11.11.An efficient way to
Q300: Assume that production from an electric utility