Figure 12.2 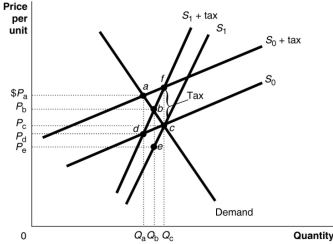 Figure 12.2 shows a demand curve and two sets of supply curves, one set more elastic than the other.
-Refer to Figure 12.2.If the government imposes an excise tax of $1.00 on every unit sold,the producer's burden of the tax
Definitions:
Conductors
Materials that allow the flow of electrical current due to their low resistance, such as metals.
Insulations
Materials or substances used to prevent the passage of electricity, heat, or sound from one area to another.
Coefficient
A numerical or constant quantity placed before and multiplying the variable in an expression (e.g., in 2x, 2 is the coefficient).
Ambient Air
The natural air in the environment surrounding a particular location, often considered in terms of its quality or temperature.
Q2: Who might be disadvantaged by deregulation of
Q47: If an increase in crime causes people
Q51: Refer to Figure 11.13.S<sub>1</sub> represents the supply
Q57: Potential GDP in Australia<br>A) does not change
Q60: The 'unemployment rate' is the percentage of
Q65: Refer to Figure 12.1.The excess burden of
Q106: Unemployment benefits paid to the unemployed<br>A) increases
Q166: For purposes of unemployment,how is a full-time
Q195: 'When it comes to public goods,individuals do
Q219: Why might firms pay wages that are