Multiple Choice
Refer to Figure 15.2 for the following questions.
Figure 15.2 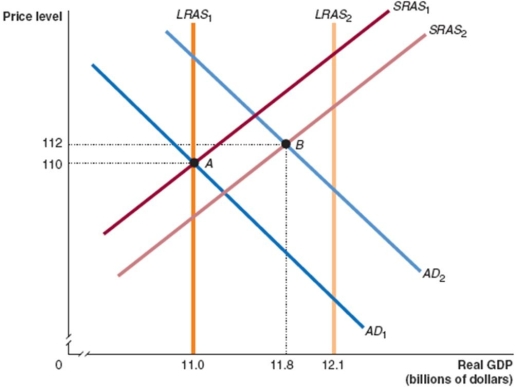
-In Figure 15.2,given the economy is at point A in year 1 and point B in year 2,what is the growth rate in potential GDP between those two years?
Definitions:
Related Questions
Q22: Refer to Figure 18.5.If government purchases increase
Q28: The 'underground economy' can be described as<br>A)
Q43: If tax reduction and simplification are effective,then
Q76: Assume that the CPI in 2018 was
Q78: When a grocery store accepts your $10
Q80: The narrowest definition of the money supply
Q100: When the Reserve Bank of Australia raises
Q137: Which of the following can cause demand-pull
Q140: What are sticky prices or wages,and how
Q162: 'Demand-pull inflation' is characterised by<br>A) high levels